Summary
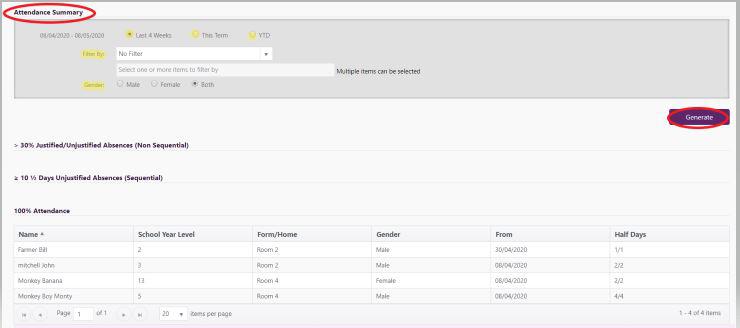
Summary data includes sequential unjustified absences, statistics, and attendance pie chart
School-wide analysis of attendance summary data by all year levels
Click here for Interventions/ AMP
Choose the date range at the top of the page and the information provided is for the whole school, not individual students for the last 4 weeks, this year or Year to date (YTD). The YTD date range begins from the first school open day in the current academic year. A PDF containing both table and all results is available to print.
-
>30% Justified/Unjustified Absences (Non Sequential)
-
Set to filter and generate to see data which fits this criteria displayed in table view, half days column showing total absence half days / total possible half days
-
-
≥10½ days Unjustified Absences (Sequential)
-
Generate to the left of this heading to list any students with attendance data fitting this criteria showing number of students with ≥ 10½ days consecutive absences
-
-
To display 100% Attendance data click the chevron beside this heading to list students with no absences (providing three weeks of data is entered)
-
Where the chosen date range is before the date the student started at your school, the student's school start date is displayed.


-
-
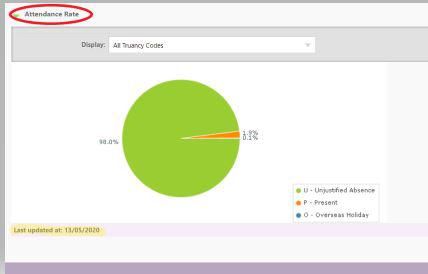
The Attendance Rate for school-wide attendance analysis expands out to a graph which displays the percentage of attendance for each timetabled session over the year to date. The count for sessions of that type (eg. Day 1 Session 1) and number of students in the year level is shown. The maximum possible attendance for each year level together with the actual number of students present for that session is displayed as a percentage.
-
It's important to note that this report generates overnight, which means that the data contained is up to date as of yesterday, but does not include today's attendance data.
-
A check box decides whether to 'Count blanks as truant' into the calculations.
-
The analysis includes more detail, in percentages, when you hover over each Year within the timetable session for the year to date statistics. Select a segment to highlight corresponding codes in the table. Each year level is represented with a different colour, described in the key.
-
The percentage is derived from (Number Students Present/Total Number of Students = Percentage eg 100/115 = 86.96%) for the year to date. Unmarked sessions are ignored in the calculation.
-
Clicking on an individual student link takes you to the Student Attendance Summary page.
Interventions
Looking for more answers? email support with your question.